Engaged readers are younger than expected on the
Christian Science Monitor (CSM) website
By Janco Damas
Inside the newsroom, depending on who you talk to, "user engagement" has several meanings. There is no objective definition of the term, so there is also no objective way to answer what age group of readers are most engaged. The assumption for many different reasons was that CSM readers were at least 50-years-old but there was no data to support that, just a gut feeling. So I set out to find the data and report back to CSM management.
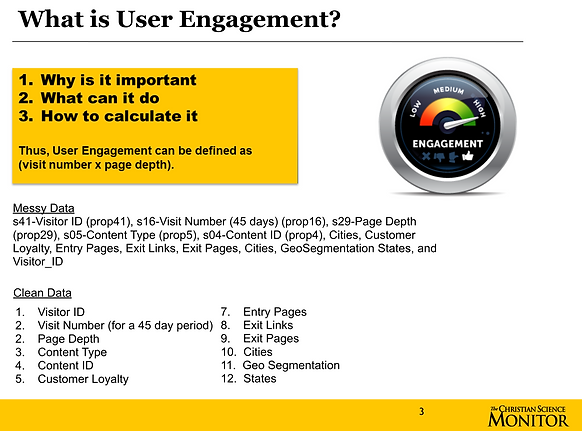
Rather than use a text book definition of user engagement, I found a formula worked best. Using the CSM's Adobe Analytics Data, the most meaningful definition of the term came from a formula where Number of Visits x Page Depth = User Engagement. In other words, for a given user; how many times did they visit the site during a 45 day period and how many pages did they view per visit. This does not consider length of time spent on each page. Time was left out because that data proved faulty i.e. many users simply leave the website running and look away which is not being engaged by any definition of the word.

Having defined user engagement, I needed a quick way to get just that specific data in useable form from the Adobe Analytics report. Built this macro in excel to turn a messy Adobe Analytics report into a clean data sheet and it worked beautifully.

Visualizing the data in Tableau it was great to see the locations of highest user engagement during the 45 day period. However, this didn't tell anything personal about the reader or the areas where they lived. I called this "non-integrated" data because it is only representing CSM internal data with no outside data sources for context.

These above are examples of outside data sources. Now that I know what cities have the highest user engagement, I can integrate outside data sources to learn statistic information about those cities. By aligning CSM's data from Adobe Analytics with one or more outside source of data, that produces "integrated data" and provides greater context with which management can make decisions.
For the example below, CSM data is integrated with Nielson data.

To integrate the two sources of data I built a custom dashboard. This particular view is pulling user engagement from CSM's data and juxtaposing it with median age data from Nielson. That's user engagement based on city along the x-axis and population median age also based on city along the y-axis. Remember from the earlier slide, I defined user engagement and calculated it from CSM's Adobe Analytics report using the formula number of visits x page depth.

There was an assumption that substantially all of CSM's readers were over 50-years-old. At least for the 45 day period where I measured that was not likely to be true.
Using the sliding filters I built into the custom dashboard, one can isolate to view cities with highest user engagement. Keep an eye on the y-axis, now you see the highest user engagement is coming from cities where the median age is 28 - 44 years old according to Nielson's research. The circled cluster in red is worth paying attention to. It suggests readers in these cities between the ages of 32 and 38 years old were the most probable visitors to CSM's website driving engagement during this 45 day period.
*You probably see Chicago out there in the far right. I ofcourse discussed that with management and discovered it was a singular outlier that wasn't represented anywhere else in the data. It didn't seem likely to happen again, but certainly worth monitoring.